OpenHazards Forecasts
Forecasts versus predictions
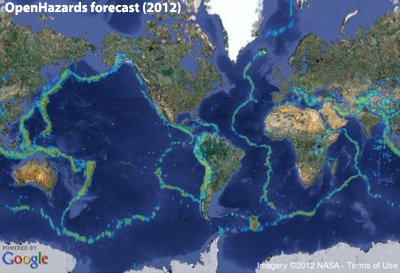
An OpenHazards forecast — earthquakes are forecast as brightly colored spots.
An example forecast: "There is a 40% probability that an earthquake having a magnitude between 6.5 and 7.0 will occur within a 20 km radius around location X during the next 3 months."
By contrast, a prediction specifies whether an earthquake either will or will not occur at a given location, during a given time window, within a given magnitude range.
An example prediction: "There will be a magnitude 5.0 or greater earthquake within a 50 km radius around location Y during the next year."
In short, a forecast is a probability (percent chance), whereas a prediction is a "binary statement" (yes or no). An individual prediction can be validated by a single observation: either an earthquake did or did not occur when and where it was predicted. By contrast, a forecast cannot be validated by a single observation: If an earthquake occurs, that event will neither prove nor disprove that there was a 40% probability it would occur. Forecasts can, however, be tested and validated by analyzing the results of many observations.
How forecasts are tested
Forecasts can be validated by processes called backtesting and monitoring. OpenHazards validates its forecasts using both backtesting and monitoring.
Backtesting is used for forecast methods that rely on data that was recorded over a long period of time. OpenHazards' earthquake forecasts, for example, use the historical earthquake record. Backtesting essentially pretends that the forecast is being run at some time in the past. Then, no data that was collected after that time is used in the backtesting forecast. For example, if researchers wanted to backtest their forecasting method from the year 2002, only data that was collected before 2002 would be fed into the method. This is the important point: assuming they already had developed their forecast method in 2002, the researchers could have made this exact forecast in 2002, because they are using only the data they would have had in 2002. The forecast from this backtesting is actually a forecast beginning from the cutoff time in the data; in the example, a forecast from 2002 onward. This retroactive forecast can then be compared with the actual data from the cutoff time (2002 in the example) to the present day. Backtesting is, at least in theory, essentially no different than having made the forecast in the past, and then waiting until the present to see what actually happened and how accurate the forecast was.
The accuracy of the forecasting method is scored using a variety of statistical tests. These tests determine resolution, or how well the forecast discriminates between alternative outcomes; reliability, or how closely the predicted frequency of events matches the observed frequency of events; and sharpness, or how extensively the forecast deviates from the average. To be validated, forecasts must achieve a pre-determined level of accuracy for the testing period.
In monitoring, actual forecasts for future events are computed, and then actual events are observed in real time. The results are scored using the same types of statistical analysis used in backtesting. Many researchers consider monitoring to be a higher level of validation than backtesting, since the “answer” is not known in advance. Such knowledge might influence decisions made when developing the forecast method. However, monitoring can take many years of real time observation to determine the accuracy of a forecast method, whereas backtesting results can be computed within days, weeks, or a few months at most.
The OpenHazards method and other forecasts
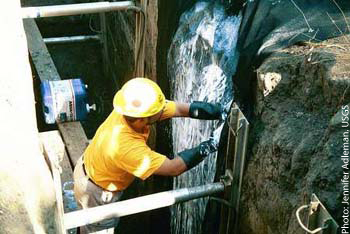
Photograph from a 2001 trenching study near Tule Pond, Fremont, California.
The process of computing these probabilities is an extensive consultation and collaboration among more than one hundred scientists. Consensus of expert opinion plays a significant role in deciding on individual probability values. Producing a single new forecast this way requires coordinated effort from the seismology community and takes several years.
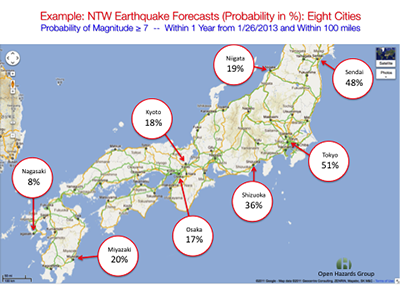
OpenHazards can make data-driven forecasts worldwide. This image, from a recent OpenHazards presentation, forecasts earthquake probabilities for eight major Japanese cities.
The OpenHazards forecast also notably has a working “memory” — the model considers recent earthquake activity when computing future risk. Statistical forecasting models are based on some type of statistical distribution, which defines the odds that a certain number of "events" (in this case, earthquakes) will happen within a given period of time. Commonly, earthquake forecasting models use what is called a Poisson distribution, but the OpenHazards model uses a new kind of Weibull distribution. One important difference between the two distributions is that the Weibull distribution allows the odds of an earthquake happening to change over time based on the occurrence of past earthquakes, while Poisson probabilites never change over time. OpenHazards' "Natural Time Weibull" (NTW) method reflects the changing probabilities for both primary earthquakes and their aftershocks.
Papers describing the basis of methods for the OpenHazards forecast have been published in the peer-reviewed literature for over a decade. The first of several papers describing details of the NTW forecast has just been accepted for publication as well. Our innovative work in computing has made it possible to use these well-documented methods to produce cutting-edge daily forecasts.
Poll


| 1. | Tokyo | 68 |
| 2. | Los Angeles | 25 |
| 3. | Manila | 18 |
| 4. | Bandung | 17 |
| 5. | Santiago | 16 |
| 6. | Nagoya | 9.4 |
| 7. | Osaka | 9.4 |
| 8. | Jakarta | 9 |
| 9. | Lima | 8 |
| 10. | Chengdu | 7.5 |